Events & recreation research · Published November 3, 2026 · Updated 2026-11-03
Updated November 3, 2026.
Planning something near home starts with the kind of experience you want: a concert, a family activity, an exhibition, a brewery gathering or time outside. This reference brings together original reports on the region’s cultural programming and recreation, with the source and reporting period beside every observation.
West of Denver Events focuses on Arvada, Boulder, Golden, Lafayette, Lakewood, Louisville, Morrison, Superior and Wheat Ridge. The statistics below also use clearly identified county, metro and statewide context. Most annual observations describe completed reporting periods, rather than the current week. Use the weekend planner for current ideas and confirm details with each organizer.
Key Takeaways
- Red Rocks: Ticketed guests: 1.75 million (Calendar 2025). (Denver Arts & Venues, November 2026)
- Red Rocks: Total events: 236 (Calendar 2025). (Denver Arts & Venues, November 2026)
- In-person cultural engagements: 14.52 million (2024). (BBC Research & Consulting, November 2025)
- Cultural volunteers: 34,042 (2024). (BBC Research & Consulting, November 2025)
- Arvada Center: Arvada Powwow attendance: More than 5,000 (Fiscal year ended June 30, 2025). (Arvada Center, November 2026)
- JCPL: Summer Reading Challenge participants: More than 24,000 (Calendar 2025). (Jefferson County Public Library, May 2026)
- JCPL: Culture Pass: free-access destinations: 18 (Calendar 2025). (Jefferson County Public Library, May 2026)
- Boulder County: Minimum estimated system visits: 1,784,228 (Calendar 2025). (Boulder County Parks & Open Space, April 2026)
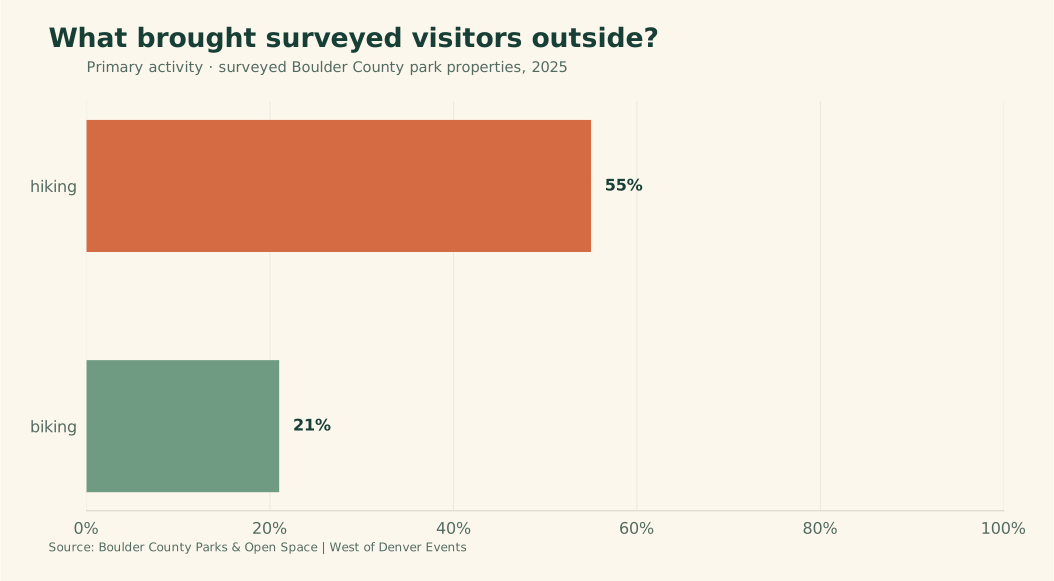
- Survey respondents: Primary activity: hiking: 55% (Survey: May 10–September 30, 2025). (Boulder County Parks & Open Space, June 2026)
- Colorado: Craft breweries: 423 (Calendar 2025). (Brewers Association, November 2026)
- Total cultural economic activity: $3.120 billion (2024). (BBC Research & Consulting, November 2025)
- Cultural-tourism economic impact: $692 million (2024). (BBC Research & Consulting, November 2025)
How much live programming happens around Denver?
Look beyond the concert headline. Red Rocks reports fitness, film and graduation activity alongside its music calendar, while the region’s performing-arts institutions add a different kind of live program. These are separate venues and reporting systems, so the figures below should not be summed into a total for Denver-area events. For a local outing, begin with the type of experience you want and then check the organizer’s current listing. An annual event count describes programming volume; it does not reveal available seats, this week’s schedule or admission prices. The venue and program labels here keep that distinction visible.
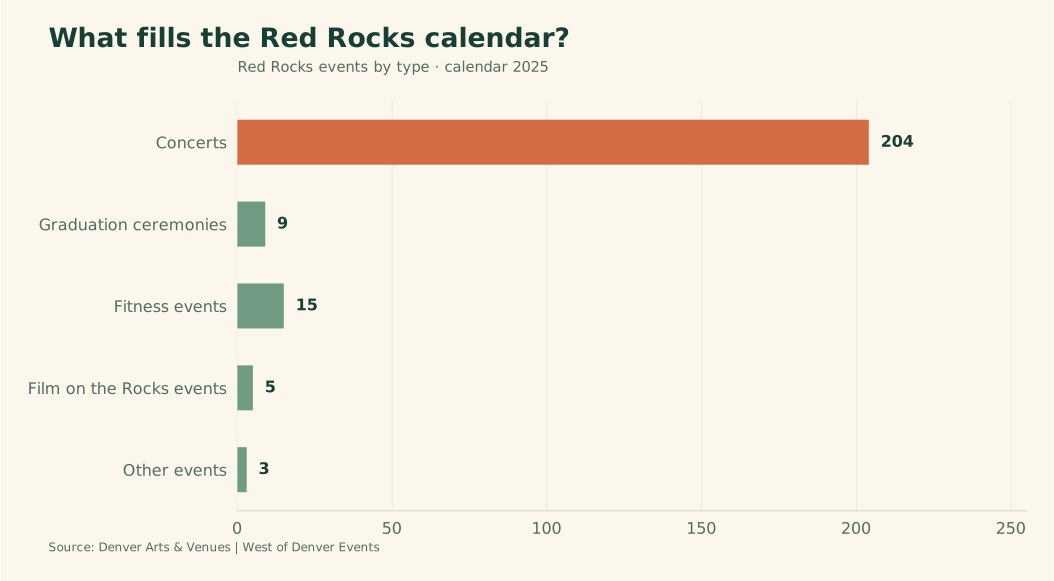
What kinds of events did Red Rocks present?
Its reported calendar includes several kinds of programming beyond live music. The categories below belong to the same annual venue report and retain their event labels. A venue’s yearly mix can help explain why it appears in music, fitness and film guides at different times. It is not a schedule for the current season. Treat the figures as historical context and follow the official event page for dates, admission, arrival instructions and any changes. When comparing event types, distinguish the number of events from the number of people attending them.
| Measure | Reporting period | Statistic and source |
|---|---|---|
| Red Rocks: Concerts | Calendar 2025 | 204 (Denver Arts & Venues, November 2026) |
| Red Rocks: Graduation ceremonies | Calendar 2025 | 9 (Denver Arts & Venues, November 2026) |
| Red Rocks: Fitness events | Calendar 2025 | 15 (Denver Arts & Venues, November 2026) |
| Red Rocks: Film on the Rocks events | Calendar 2025 | 5 (Denver Arts & Venues, November 2026) |
| Red Rocks: Other events | Calendar 2025 | 3 (Denver Arts & Venues, November 2026) |
What do attendance and performer counts measure?
The visitor and performer figures describe different aspects of one venue. Paid attendance, leisure visits, performers and headline debuts each retain their source definition. Keep those labels when citing a number. A person can attend more than one show, so annual attendance should not be described as an equal number of unique people. Likewise, the leisure-visitor figure belongs to a different type of visit from a ticketed event. The performer measures describe programming rather than audience size.
| Measure | Reporting period | Statistic and source |
|---|---|---|
| Red Rocks: Leisure visitors | Calendar 2025 | More than 1 million (Denver Arts & Venues, November 2026) |
| Red Rocks: Individual performers | Calendar 2025 | 559 (Denver Arts & Venues, November 2026) |
| Red Rocks: Debut headline performances | Calendar 2025 | 50 (Denver Arts & Venues, November 2026) |
| Red Rocks: Shows by Hall of Fame inductees | Calendar 2025 | 19 (Denver Arts & Venues, November 2026) |
| Red Rocks: Trail Mix Sessions | Calendar 2025 | 9 (Denver Arts & Venues, November 2026) |
How do other live-programming settings compare?
The Arts Complex and Arvada Center observations provide additional institutional context. The youth-symphony enrollment and concert counts describe one educational program, not total Arvada Center attendance.
Use these rows to broaden the picture rather than rank venues by popularity. A large multi-venue complex and a youth ensemble organize very different experiences. A fair citation carries the institution, program and reporting period with the figure. For the next performance you can attend, browse live music west of Denver, then confirm availability with the organizer. That step connects the historical reference to a practical plan while keeping the current listing separate from the annual measures shown here.
| Measure | Reporting period | Statistic and source |
|---|---|---|
| Arts Complex: events | Calendar 2025 | 2,220 (Denver Arts & Venues, November 2026) |
| Arts Complex: attendance | Calendar 2025 | 1,320,999 (Denver Arts & Venues, November 2026) |
| Front Range Youth Symphony: live concerts | Fiscal year ended June 30, 2025 | 3 (Arvada Center, November 2026) |
| Front Range Youth Symphony: enrolled students | Fiscal year ended June 30, 2025 | 133 (Arvada Center, November 2026) |
How are arts and cultural experiences being used?
Cultural participation is broader than paid ticket sales. The regional nonprofit study includes in-person engagements, school outreach and volunteering, while the Arvada Center report adds a closer view of local programs. The study’s footprint is the SCFD-funded nonprofit sector, not every concert, gallery or commercial attraction in the region. Use the reporting boundaries before comparing the figures. Regional engagements cannot be assigned to the nine towns covered by West of Denver Events, and an institution’s outreach can reach beyond the city where it is based.
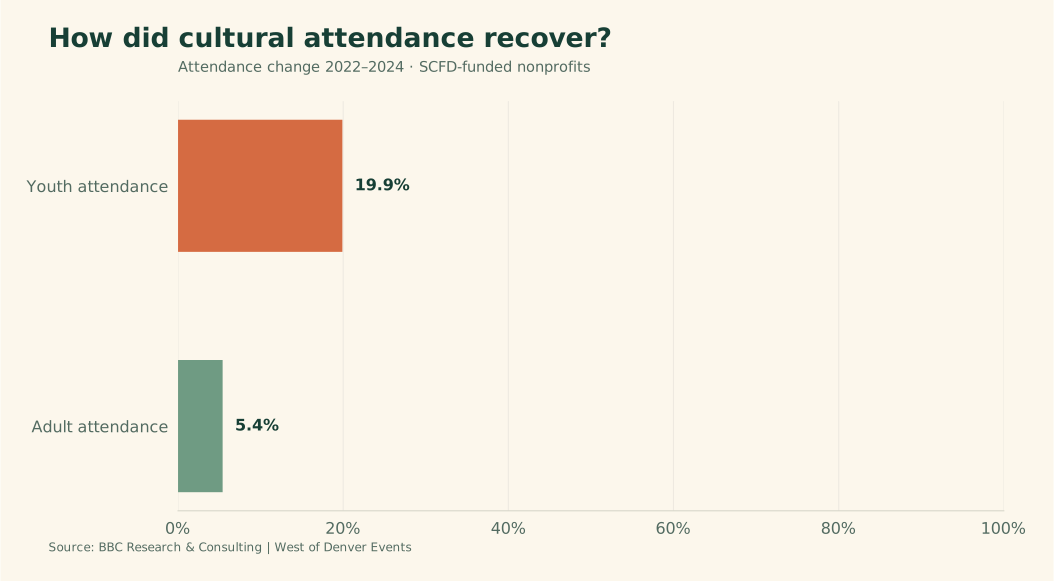
What does the regional study say about engagement?
The study tracks in-person participation separately from virtual engagement. Its comparisons show recovery over specified windows, rather than growth during the current year. The source draws on grant reports from funded organizations and describes exclusions in its methodology. Those boundaries matter when a figure is quoted outside the report. Keep the institutional scope and comparison years together, particularly for youth and adult attendance changes. Virtual engagements are shown as a separate observation because the researchers excluded them from the economic analysis.
| Measure | Reporting period | Statistic and source |
|---|---|---|
| Attendance change since 2022 | 2022–2024 | +12.5% (BBC Research & Consulting, November 2025) |
| Attendance change since 2019 | 2019–2024 | −5.0% (BBC Research & Consulting, November 2025) |
| SCFD-funded organizations in study | 2024 | 285 (BBC Research & Consulting, November 2025) |
| Youth attendance change since 2022 | 2022–2024 | +19.9% (BBC Research & Consulting, November 2025) |
| Adult attendance change since 2022 | 2022–2024 | +5.4% (BBC Research & Consulting, November 2025) |
| Reported virtual engagements, excluded from economic analysis | 2024 | More than 650,000 (BBC Research & Consulting, November 2025) |
How much participation comes through volunteers and schools?
Volunteering and school outreach reveal forms of involvement that a ticket-sales total would miss. Hours, people and educational experiences are separate measures.
The table preserves those units so an hour of service is not confused with a visit or a school experience. The changes refer to the stated comparison years and should not be described as changes since last month. School-outreach experiences can include repeat participation. Volunteer counts and hours also should not be combined into attendance. These observations are useful for discussing how cultural institutions connect with their communities, while retaining the source’s distinction between participating, learning and supporting a program.
| Measure | Reporting period | Statistic and source |
|---|---|---|
| Volunteer hours | 2024 | 1,295,619 (BBC Research & Consulting, November 2025) |
| Volunteer-count change since 2022 | 2022–2024 | +21.6% (BBC Research & Consulting, November 2025) |
| Volunteer-hours change since 2022 | 2022–2024 | +12.1% (BBC Research & Consulting, November 2025) |
| School-outreach experiences | 2024 | 4,569,012 (BBC Research & Consulting, November 2025) |
What does Arvada Center’s report add locally?
The Arvada Center measures cover its fiscal year, including local activity and outreach delivered beyond Arvada. Gallery RSVP records are not presented as a census of everyone entering the galleries. Read the individual program labels rather than treating all rows as visits to one building. An outreach experience, a gallery RSVP and participation at a community celebration have different definitions.
| Measure | Reporting period | Statistic and source |
|---|---|---|
| Arvada Center: Gallery visitors using RSVP system | Fiscal year ended June 30, 2025 | 35,121 (Arvada Center, November 2026) |
| Arvada Center: School/community arts experiences | Fiscal year ended June 30, 2025 | 82,731 (Arvada Center, November 2026) |
| Arvada Center: Schools and community organizations served | Fiscal year ended June 30, 2025 | 367 (Arvada Center, November 2026) |
| Arvada Center: Students reached through community outreach | Fiscal year ended June 30, 2025 | 7,627 (Arvada Center, November 2026) |
| Arvada Center: Arvada schools served | Fiscal year ended June 30, 2025 | 26 (Arvada Center, November 2026) |
What do free and family programs contribute?
A family outing does not have to begin with a ticket purchase. The library report documents free camps and Culture Pass access alongside community programming; the Arvada Center report describes a separate set of educational opportunities. Free admission and advance registration are different questions, so check both before making plans. These observations show reported participation and program availability during the stated periods. They do not promise that a particular camp, pass or performance has space today. Library-system totals and institution-specific figures also should not be combined into a local participation rate.
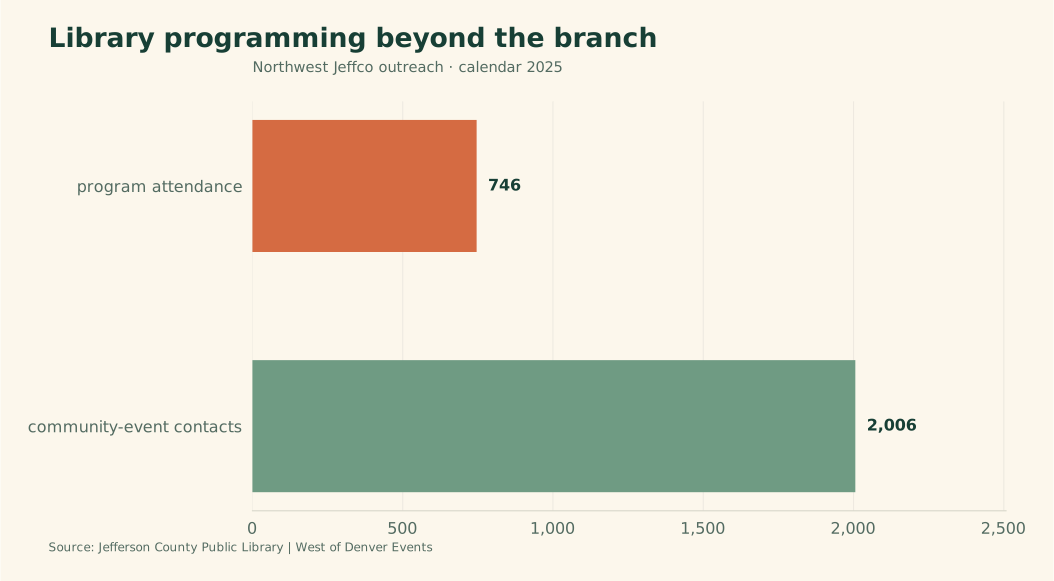
How does library programming reach people outside a branch?
Northwest Jeffco’s figures distinguish hosted programs from contacts at community events. The adult technology observations belong to the broader library report. A program attendee and a community-event contact are not necessarily different people. Preserve the categories rather than adding them as a unique audience. The number of classes also differs from the number of participants: each describes a separate aspect of access to learning.
| Measure | Reporting period | Statistic and source |
|---|---|---|
| JCPL: Northwest Jeffco: programs | Calendar 2025 | 37 (Jefferson County Public Library, May 2026) |
| JCPL: Northwest Jeffco: program attendance | Calendar 2025 | 746 (Jefferson County Public Library, May 2026) |
| JCPL: Northwest Jeffco: community-event contacts | Calendar 2025 | 2,006 (Jefferson County Public Library, May 2026) |
| JCPL: Northwest Jeffco: community events attended | Calendar 2025 | 9 (Jefferson County Public Library, May 2026) |
| JCPL: Adult technology classes | Calendar 2025 | 179 (Jefferson County Public Library, May 2026) |
| JCPL: Adult technology-class participants | Calendar 2025 | More than 600 (Jefferson County Public Library, May 2026) |
What do family festivals, camps and performances report?
The observations cover several kinds of participation, from a reading challenge to camps and live theatre. They retain lower-bound language wherever the original report uses it. For your next outing, explore family events or free events west of Denver.
| Measure | Reporting period | Statistic and source |
|---|---|---|
| JCPL: Raise A Reader Festival attendees | Calendar 2025 | More than 1,600 (Jefferson County Public Library, May 2026) |
| JCPL: Shakespeare in the Parking Lot attendees | Calendar 2025 | More than 500 (Jefferson County Public Library, May 2026) |
| JCPL: Noon Year’s Eve attendees | Calendar 2025 | 1,009 (Jefferson County Public Library, May 2026) |
| JCPL: Free summer youth camps | Calendar 2025 | 29 (Jefferson County Public Library, May 2026) |
| JCPL: Summer-camp youth participation | Calendar 2025 | 1,423 (Jefferson County Public Library, May 2026) |
| JCPL: Locations hosting summer youth camps | Calendar 2025 | 9 (Jefferson County Public Library, May 2026) |
| Arvada Center: Summer-camp registrations | Fiscal year ended June 30, 2025 | More than 4,100 (Arvada Center, November 2026) |
| Arvada Center: Education-program students served | Fiscal year ended June 30, 2025 | 7,611 (Arvada Center, November 2026) |
| Arvada Center: Theatre for Young Audiences students | Fiscal year ended June 30, 2025 | 23,193 (Arvada Center, November 2026) |
How do access programs connect families with destinations?
Culture Pass figures describe use of the library’s access program. The Direct Impact Fund observation describes students supported through an Arvada Center initiative.
A destination count measures the breadth of a program at the time of reporting, while patrons and bookings describe use. A booking is not automatically a unique person or family. Likewise, financial support for students is a different measure from public attendance. Keep those distinctions when using the figures to discuss access. For a visit today, consult the current program requirements and booking process instead of relying on an annual total. An opportunity can have no admission charge and still require eligibility, a reservation or a particular visit time.
| Measure | Reporting period | Statistic and source |
|---|---|---|
| JCPL: Culture Pass: patrons using program | Calendar 2025 | 6,981 (Jefferson County Public Library, May 2026) |
| JCPL: Culture Pass: Butterfly Pavilion bookings | Calendar 2025 | 1,908 (Jefferson County Public Library, May 2026) |
| Arvada Center: Students supported by Direct Impact Fund | Fiscal year ended June 30, 2025 | 5,221 (Arvada Center, November 2026) |
What do park and trail figures reveal about local outings?
Visits are not unique visitors. Boulder County’s counter-based estimates describe use of its parks, while its visitor survey describes the experiences of respondents during a separate collection period. Jefferson County’s figures cover cumulative work under a multiyear conservation plan. Keeping those three views separate makes the outdoor data usable. For an outing, use the observations as context rather than a forecast of crowding or conditions. An annual estimate does not tell you whether a trail is open, dry or suitable for your group today. Check the managing agency’s current alerts and route details.
Which Boulder County properties recorded substantial use?
The report provides minimum estimated visits for the county system and named properties. The source explains that counters, adjustments and estimates contribute to its annual totals. A visit can be made by someone who returns repeatedly. It should not be renamed a visitor, resident or tourist count. Property-level observations are useful for describing historical use, but should not be treated as a ranking of the best places to go. Routes, closures, access and suitability matter for an individual plan.
| Measure | Reporting period | Statistic and source |
|---|---|---|
| Boulder County: Pella Crossing visits | Calendar 2025 | 167,583 (Boulder County Parks & Open Space, April 2026) |
| Boulder County: Walden Ponds visits | Calendar 2025 | 128,628 (Boulder County Parks & Open Space, April 2026) |
| Boulder County: Carolyn Holmberg Preserve visits | Calendar 2025 | 96,078 (Boulder County Parks & Open Space, April 2026) |
| Boulder County: Betasso Preserve visits | Calendar 2025 | 71,242 (Boulder County Parks & Open Space, April 2026) |
| Boulder County: Coalton Trailhead visits | Calendar 2025 | 35,119 (Boulder County Parks & Open Space, April 2026) |
What did surveyed park users say about their visit?
The percentages describe respondents to individual questions in the county’s visitor survey. They are not a survey of all Denver-area residents or all visits throughout the year.
| Measure | Reporting period | Statistic and source |
|---|---|---|
| Survey respondents: Primary activity: biking | Survey: May 10–September 30, 2025 | 21% (Boulder County Parks & Open Space, June 2026) |
| Survey respondents: Travel mode: car | Survey: May 10–September 30, 2025 | 86% (Boulder County Parks & Open Space, June 2026) |
| Survey respondents: Visit with family | Survey: May 10–September 30, 2025 | 44% (Boulder County Parks & Open Space, June 2026) |
| Survey respondents: Visit alone | Survey: May 10–September 30, 2025 | 35% (Boulder County Parks & Open Space, June 2026) |
| Survey respondents: Sought information before visit | Survey: May 10–September 30, 2025 | 25% (Boulder County Parks & Open Space, June 2026) |
| Survey respondents: Trailhead: not at all crowded | Survey: May 10–September 30, 2025 | 70% (Boulder County Parks & Open Space, June 2026) |
| Survey respondents: Trail: not at all crowded | Survey: May 10–September 30, 2025 | 71% (Boulder County Parks & Open Space, June 2026) |
| Survey respondents: No conflict experienced that day | Survey: May 10–September 30, 2025 | 94% (Boulder County Parks & Open Space, June 2026) |
What changed under Jefferson County’s conservation plan?
These accomplishments span the entire conservation-plan window. They are not annual totals for the final year of the report. New trail mileage, acquired acreage and education contacts describe different parts of the work. Visitor-amenity locations refer to places receiving improvements under the plan, not the total number of parks or trailheads in the county. Keep those units and the cumulative period attached when quoting them.
| Measure | Reporting period | Statistic and source |
|---|---|---|
| Jeffco: New trails | Cumulative 2020–2025 accomplishments | 23.63 miles (Jefferson County Parks & Open Space, January 2026) |
| Jeffco: Land acquired | Cumulative 2020–2025 accomplishments | 4,486.21 acres (Jefferson County Parks & Open Space, January 2026) |
| Jeffco: Stewardship education contacts | Cumulative 2020–2025 accomplishments | 651,169 (Jefferson County Parks & Open Space, January 2026) |
| Jeffco: Visitor-amenity park locations | Cumulative 2020–2025 accomplishments | 28 parks (Jefferson County Parks & Open Space, January 2026) |
| Jeffco: Visitor-amenity trailhead locations | Cumulative 2020–2025 accomplishments | 18 trailheads (Jefferson County Parks & Open Space, January 2026) |
How do breweries fit into the region’s gathering places?
Use statewide brewery data as background, then look locally for the event. Colorado production and economic measures do not count west-metro taproom concerts, trivia nights or food-truck visits. The competition figures below describe entries and awards, which are a different part of the brewing ecosystem. The distinction matters because a festival’s public attendance, the producers pouring at the festival and the entrants in its professional competition are separate populations. The competition observations below retain their own population and category labels. For a neighborhood plan, the relevant details remain the venue, event time, age policy, admission and current organizer information.
What does the Colorado craft-brewery profile measure?
The state profile reports breweries, production and modeled economic measures. The brewery-density and per-adult production observations retain the adult population definition printed by the source. These are Colorado-wide measures, not a count of breweries within the site’s nine towns. Economic impact and beverage output also should not be used as estimates of spending at a local event. For a visitor choosing where to go, the useful next step is a venue-level calendar and the details for that particular date.
| Measure | Reporting period | Statistic and source |
|---|---|---|
| Colorado: Breweries per 100,000 adults 21+ | Calendar 2025 | 9.4 (Brewers Association, November 2026) |
| Colorado: Economic impact | Calendar 2025 | $2.526 billion (Brewers Association, November 2026) |
| Colorado: Reported economic impact per capita | Calendar 2025 | $559 (Brewers Association, November 2026) |
| Colorado: Craft-beer production | Calendar 2025 | 854,707 barrels (Brewers Association, November 2026) |
| Colorado: Production per adult 21+ | Calendar 2025 | 5.9 gallons (Brewers Association, November 2026) |
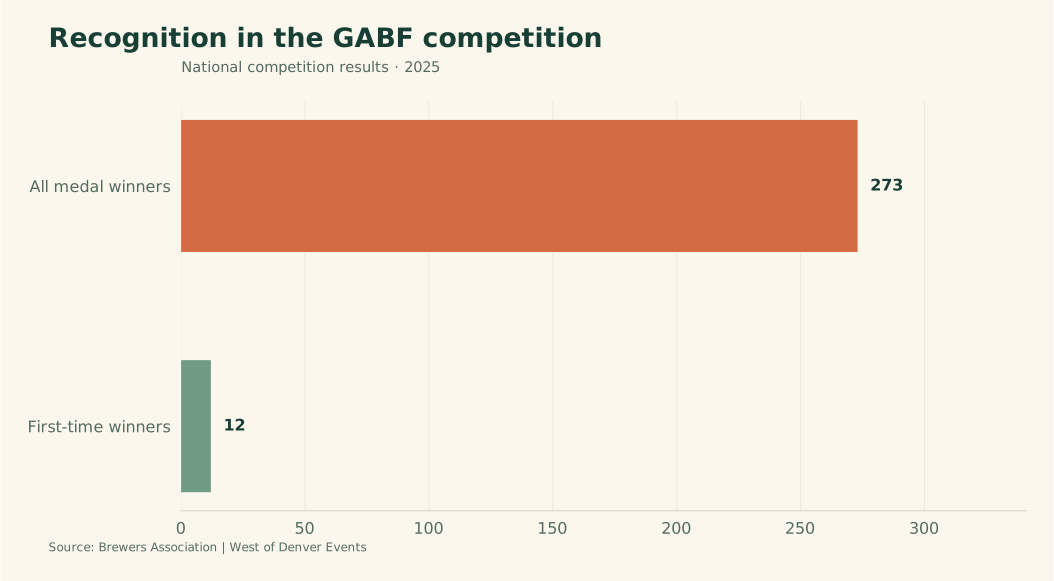
What do the GABF competition results show?
The competition measures describe judged entries and recognition. They do not count festival attendees or the breweries physically pouring at a public session. Keep that distinction when citing the number of entrants, medal winners or first-time winners. The results concern a national competition associated with the Denver-hosted festival, not Colorado-only performance. For something happening closer to home, browse breweries and food-truck schedules, then follow the venue’s current event details.
| Measure | Reporting period | Statistic and source |
|---|---|---|
| GABF competition: Beers judged | 2025 GABF competition | 8,315 (Brewers Association, November 2026) |
| GABF competition: Competing breweries and cideries | 2025 GABF competition | 1,555 (Brewers Association, November 2026) |
| GABF competition: Medals awarded | 2025 GABF competition | 347 (Brewers Association, November 2026) |
| GABF competition: Medal-winning breweries and cideries | 2025 GABF competition | 273 (Brewers Association, November 2026) |
| GABF competition: First-time competition entrants | 2025 GABF competition | 180 (Brewers Association, November 2026) |
| GABF competition: First-time competition winners | 2025 GABF competition | 12 (Brewers Association, November 2026) |
How do cultural outings contribute to the visitor economy?
The spending around an outing reaches beyond the admission price. The cultural study models activity associated with audiences, operations and capital investment; the convention-center report provides a separate set of venue observations. These studies have different scopes and should not be added together. Keep economic activity distinct from economic impact. The cultural researchers define impact as a subset of activity, including money associated with visitors from outside the region. Their figures include modeled effects and are not simply cash counted at event entrances.
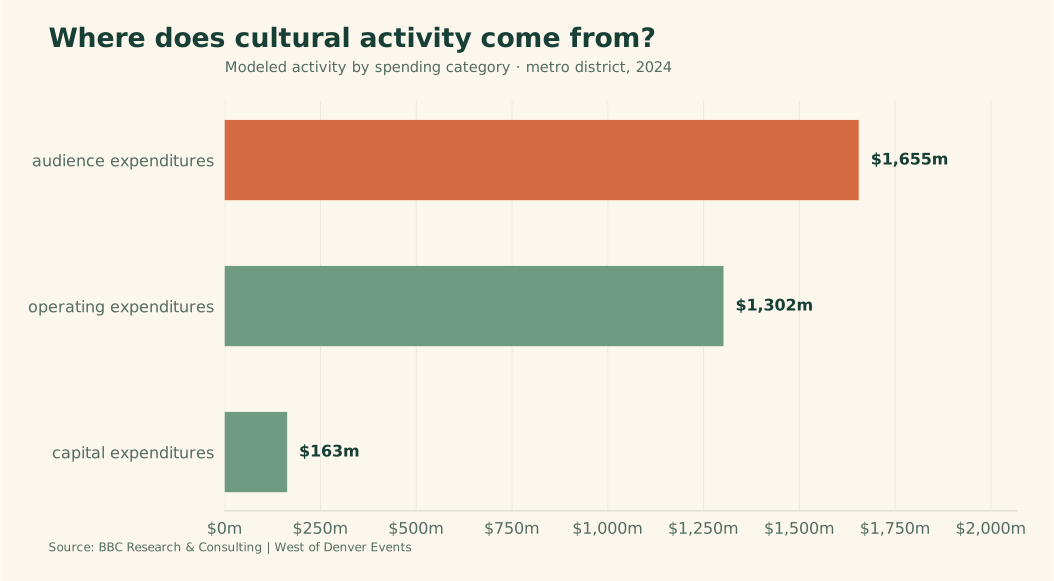
What spending is captured in the cultural model?
The model separates activity associated with spending categories from its narrower impact measure. Each observation refers to the nonprofit study’s geographic and organizational scope.
Audience, operating and capital categories should not be relabeled as ticket sales. The report includes direct and indirect effects, so the measures describe modeled economic activity rather than a single ledger of purchases. Cultural tourism is a component of the impact framework and should not be added again to the total impact. Keeping the model’s categories intact makes the reference useful to writers, organizers and community partners without overstating what a local event can claim for itself.
| Measure | Reporting period | Statistic and source |
|---|---|---|
| Activity attributed to audience expenditures | 2024 | $1.655 billion (BBC Research & Consulting, November 2025) |
| Activity attributed to operating expenditures | 2024 | $1.302 billion (BBC Research & Consulting, November 2025) |
| Activity attributed to capital expenditures | 2024 | $163 million (BBC Research & Consulting, November 2025) |
| Total cultural economic impact | 2024 | $864 million (BBC Research & Consulting, November 2025) |
What do jobs and personnel costs add to the picture?
The employment and personnel figures describe the participating cultural organizations. They do not measure the staffing requirements of an individual event.
Use them as a separate view of the institutions supporting the cultural sector. Personnel spending and audience-related activity answer different questions, even when both appear in the same economic report. A local organizer should use its own staffing, budget and attendance records when evaluating a gathering. The regional research provides background on the sector, not a forecast of revenue, jobs or customers generated by a new listing. That boundary is particularly useful when presenting figures to sponsors or community partners.
| Measure | Reporting period | Statistic and source |
|---|---|---|
| Cultural-organization jobs | 2024 | 14,466 (BBC Research & Consulting, November 2025) |
| Personnel expense | 2024 | $312 million (BBC Research & Consulting, November 2025) |
What does the convention-center report measure?
The operator reports events, attendance and selected economic estimates for the convention center and its expanded ballroom. These are Denver venue figures, not totals for west-metro communities. Keep room-night stays distinct from unique guests, and distinguish all venue activity from particular categories of meetings or ballroom bookings. For a local business planning a public gathering, accurate event details are the useful next step: share an event with West of Denver Events.
| Measure | Reporting period | Statistic and source |
|---|---|---|
| Colorado Convention Center: Events | Calendar 2025 | 181 (Denver Arts & Venues, November 2026) |
| Colorado Convention Center: Attendees | Calendar 2025 | 740,277 (Denver Arts & Venues, November 2026) |
| Colorado Convention Center: Association/tradeshow economic impact | Calendar 2025 | $677,518,247 (Denver Arts & Venues, November 2026) |
| Colorado Convention Center: Association/tradeshow hotel-night stays | Calendar 2025 | More than 531,000 (Denver Arts & Venues, November 2026) |
| Colorado Convention Center: Bluebird Ballroom: otherwise-unavailable bookings | Calendar 2025 | 30 (Denver Arts & Venues, November 2026) |
| Colorado Convention Center: Bluebird Ballroom: economic impact | Calendar 2025 | $453 million (Denver Arts & Venues, November 2026) |
Methodology and Sources
This reference contains 100 distinct cited metric-period observations from original venue reports, institutional annual reports, government research and producer-maintained industry statistics. Source pages or PDFs were opened and matching values checked on November 3, 2026. The year in the title identifies the edition, not the observation year. Citation months are publication/release months where documented; November 2026 is the access month for undated report pages and the Arvada Center report. The inventory records the date type, source location, geography, qualifiers and survey-question sample size. Repeated participation can appear in attendance measures. Figures visualize selected counted observations and do not add to the count. County, metro and statewide figures are not presented as nine-town totals. Review monthly, advance the update stamp only after rechecking sources, and confirm current outing details with organizers.
Glossary
- SCFD: Scientific and Cultural Facilities District; the cultural-funding district used in the nonprofit study.
- CBCA: Colorado Business Committee for the Arts; commissioner and publisher of the cited cultural study.
- BBC: BBC Research & Consulting; researcher that prepared the cultural study.
- JCPL: Jefferson County Public Library.
- BCPOS: Boulder County Parks & Open Space; distinct from the City of Boulder’s OSMP agency.
- OSMP: Open Space and Mountain Parks, a City of Boulder department.
- GABF: Great American Beer Festival; its professional competition and public festival have different populations.
- RSVP: A reservation or response record; gallery RSVP counts are not necessarily all gallery visitors.
- Economic activity: The study’s modeled spending-related activity, including direct and indirect effects.
- Economic impact: The narrower measure defined by the study; a subset of activity.
Sources
- Denver Arts & Venues: 2025 Venues Impact
- Arvada Center: 2024–2025 Annual Report
- BBC Research & Consulting: 2025 Economic Activity Study of Metro Denver Culture, prepared for CBCA using SCFD grant reports
- Jefferson County Public Library: 2025 Annual Report
- Boulder County Parks & Open Space: 2025 Annual Visitation Report
- Boulder County Parks & Open Space: Five Year Visitor Study 2025
- Jefferson County Parks & Open Space: 2025 Preservation Progress: Conservation Greenprint 2020–2025
- Brewers Association: State Craft Beer Sales & Production Statistics, 2025: Colorado
- Brewers Association: 2025 Annual Report: Great American Beer Festival competition
Get the week's events west of Denver — free every Thursday
A short weekend shortlist, with reasons to go, prices and reservation details. Choose your towns and interests below.
Get picks for my towns & interests →Or join the general regional roundup below. Venue emails are separate.
No spam. Unsubscribe anytime. Choose towns & interests.